
This article quantifies the financial impact to investors of “buying the dip” in the Australian equities market, by analysing returns on investment from several dips over a period of thirty years.
The term “buy the dip” refers to the practice of investing in assets, such as shares, after they have fallen in value by a certain amount. For the purpose of this article I define “dip” to be a market correction of at least 10 percent.
Successful investors who buy the dip aim to profit from these sharp changes in market movements by buying shares at discounted prices and enjoying the capital gains that follow when markets eventually recover.
Sounds simple right?
While it can be difficult to time the exact bottom of the market, buying and holding quality shares trading at a discount thanks to a “dip” can certainly pay off in the long run.
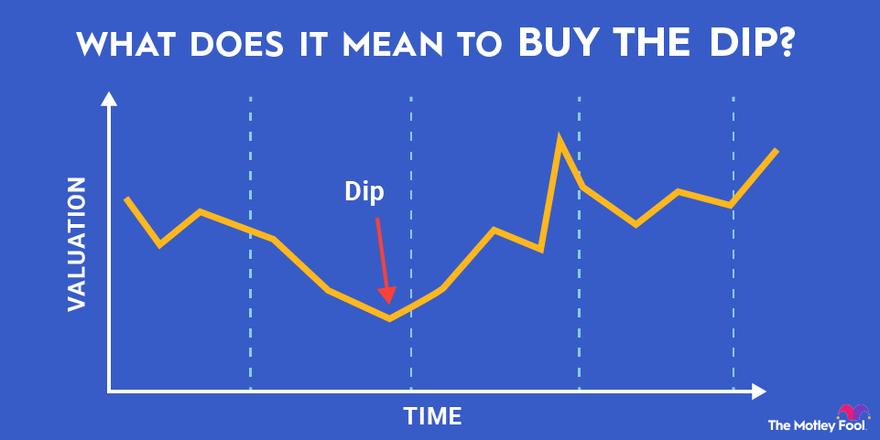
Should investors buy or sell the dip? Source: Motley Fool
As you will see in the analysis below, these dip events are typically associated with major trauma in global markets brought on by events such as September 11, the Tech Bubble, the Global Financial Crisis (the GFC), COVID-19 and the Russian/Ukraine war.
The key source of data I used to undertake the analysis is the ASX 200 Accumulation Index – ASX:XJOAI – covering the period from 1 October 1992 to 31 August 2022. This index measures the total return (capital growth plus dividend income) of the largest 200 stocks on the ASX, and is also featured in our article Best Ways To Invest $1000 For A Child.
Background
My interest in this topic peaked in recent times with falling equity markets, as the global economy came out of two-year period of COVID-19 lockdowns combined with the disruptions associated with the Russian/Ukraine war.
I was interested to know whether this falling market represented a buying opportunity and what was the experience with prior dips – e.g., if you were interested in a stock which traded at $20 prior to the dip and is trading at $15 post dip, are you more interested in the stock now?
I was also reminded of the period post GFC in 2008 and 2009 where a number of ASX 200 entities refinanced their balance sheets by raising capital at post GFC deflated prices.
It was a classic Warren Buffet moment of “…be fearful when others are greedy. Be greedy when others are fearful.”
Those investors who participated in these discounted capital raises gained significant value from the subsequent rerating of the market and the stock prices of the entities they invested in.
Anyhow, enough of the background – let’s get down to the analysis.
The ASX 200 Accumulation Index (ASX:XJOAI)
The chart below plots the ASX:XJOAI over the period October 1992 to August 2022:
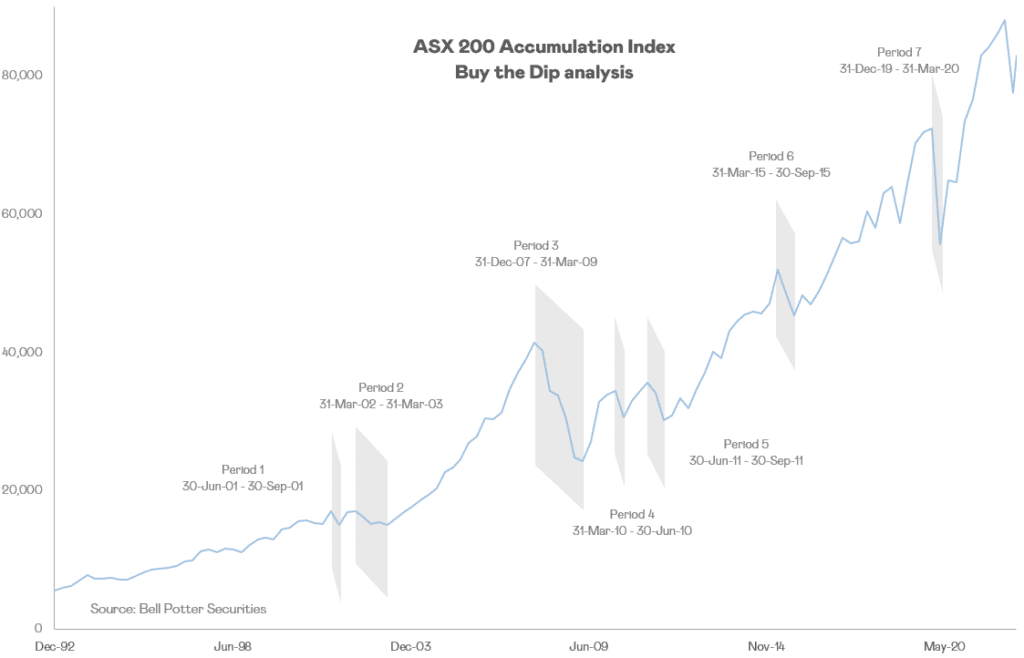
I have highlighted the seven dips greater than 10 percent over this 30-year period and these are summarised in the table below:
Australian Share Market Dips Over 30 Years
| Period | Dip Start | Dip Bottom | No. Quarters | Percentage Drop |
| 7 | 31 Dec 2019 | 31 Mar 2020 | 1 | 23.1% |
| 6 | 31 Mar 2015 | 30 Sept 2015 | 2 | 12.7% |
| 5 | 30 Jun 2011 | 30 Sept 2011 | 1 | 11.6% |
| 4 | 31 Mar 2010 | 30 Jun 2010 | 1 | 11.1% |
| 3 | 31 Dec 2007 | 31 Mar 2009 | 5 | 39.7% |
| 2 | 31 Mar 2002 | 31 Mar 2003 | 4 | 11.9% |
| 1 | 30 Jun 2001 | 30 Sept 2001 | 1 | 11.8% |
The table below compares the compound annual return up to 31 August 2022 if you bought at the Dip Start compared to the Dip Bottom along with the compounded premium return gained from successfully buying at the bottom:
| Period | Buy at Dip Start | Return % p.a. to 31 Aug 22 | Buy at Dip Bottom | Return % p.a. to 31 Aug 22 | Premium Return per annum |
| 7 | 31 Dec 2019 | 5.2% | 31 Mar 2020 | 17.9% | 12.7% |
| 6 | 31 Mar 2015 | 6.5% | 30 Sept 2015 | 9.1% | 2.6% |
| 5 | 30 Jun 2011 | 8.2% | 30 Sept 2011 | 9.7% | 1.4% |
| 4 | 31 Mar 2010 | 7.3% | 30 Jun 2010 | 8.5% | 1.2% |
| 3 | 31 Dec 2007 | 5.0% | 31 Mar 2009 | 9.6% | 4.5% |
| 2 | 31 Mar 2002 | 8.0% | 31 Mar 2003 | 9.2% | 1.1% |
| 1 | 30 Jun 2001 | 7.8% | 30 Sept 2001 | 8.5% | 0.7% |
Analysis
The above two tables show that during the GFC dip (Period 3 – Dec 2007 to Mar 2009) the market dropped by 39.7 percent. If you were invested in the market in December 2007 and held that investment to 31 August 2022, the return on investment was 5% per annum. On the other hand, if you invested at the bottom of the GFC-induced dip in March 2009 and held the investment to 31 August 2022, your return on investment over the period to 31 August 2022 was 9.6% per annum. So, investors who bought the bottom of this dip enjoyed a premium on their returns of 4.5%per annum.
The significance of this premium is evident in the table below where I value the return on a $10,000 investment at both the DIP Start and DIP Bottom up to 31 August 2022:
| Period | Dip Start | Return From $10k Invested | Dip Bottom | Return From $10k Invested | Premium Earned |
| 7 | 31 Dec 2019 | 11,445 | 31 Mar 2020 | 14,882 | $3,438 |
| 6 | 31 Mar 2015 | 15,942 | 30 Sept 2015 | 18,260 | $2,318 |
| 5 | 30 Jun 2011 | 24,242 | 30 Sept 2011 | 27,418 | $3,176 |
| 4 | 31 Mar 2010 | 24,068 | 30 Jun 2010 | 27,086 | $3,018 |
| 3 | 31 Dec 2007 | 20,578 | 31 Mar 2009 | 34,105 | $13,528 |
| 2 | 31 Mar 2002 | 48,436 | 31 Mar 2003 | 54,997 | $6,561 |
| 1 | 30 Jun 2001 | 48,642 | 30 Sept 2001 | 55,173 | $6,530 |
Once again, if we look at the GFC dip, $10,000 invested in the market at the start of the dip was valued at $20,578 at 31 August 2022. If the same investor had invested $10,000 at the bottom of the GFC dip in March 2009 it would today be valued at $34,105 – this represents a $13,528 premium over the period.
What are the lessons learned?
- Over the last 30 years there have been seven dip periods where the Australian stock market (represented by the ASX 200 Accumulation Index) decreased by at least 10%
- These dip events generally occur during periods of major trauma in global equity markets such as September 11, the Tech Bubble, the GFC, Covid 19 etc.
- The evidence is in: investors benefit over the long term from buying Australian equites (as represented by the ASX 200 Accumulation Index) during dip events and the bigger the DIP, the larger the premium to be earned.
- Over the last 30 years the Australian stock market (as represented by the ASX 200 Accumulation Index) has increased by 9.5 percent per annum. This return includes the seven dip periods noted above as well as the current period from December 2021. The total dip periods over this time are 18 quarters or 15% of the time. What does this show? – dip periods are followed by longer periods of positive return (i.e., 85% of the time) and the long-term trend is up.
- The analysis supports the case for making regular investments at regular intervals – what is commonly referred to as dollar cost averaging. You won’t be able to always pick the bottom of the dip, but if you are investing regularly (e.g., monthly) you will pick up some, and in some cases all, of the benefit of the dip over the long term. This investment strategy is particularly relevant in relation to investment accounts for children who given their age, generally have a long-term investment horizon.
Wrapping up
One hurdle to “buying the dip” is that no dip is the same, with market corrections varying in size and duration, and each displaying their own unique rates of recovery.
However, as the analysis shows, given the long term trend is up, investors can enjoy a premium on their returns over the long term, by “buying the dip” during downward market movements.
When it comes to investing the sooner you start, the more time compounding growth has to work it’s magic. Consider joining the Itrust Invest community today and start to make a real difference to the future of your loved ones.
If you’d like to know more then speak to the team via the live chat below, or give us a call on 1300 811 119 – we’d love to hear from you.
Copyright © Itrust Invest 2022
Disclaimer: in preparing this blog we have not considered your personal investment objectives, financial situation or needs. Instead, this blog contains general advice and has been prepared for informational purposes only. It is not intended as financial product advice or a recommendation in relation to any investments or securities. Terms apply when using the platform provided by Itrust Investment Fund, and it is important you read the PDS and key documents before deciding if any of our offerings are right for you.